Pairs Trading Performance Report
Generated: 2026-01-12 14:34:51
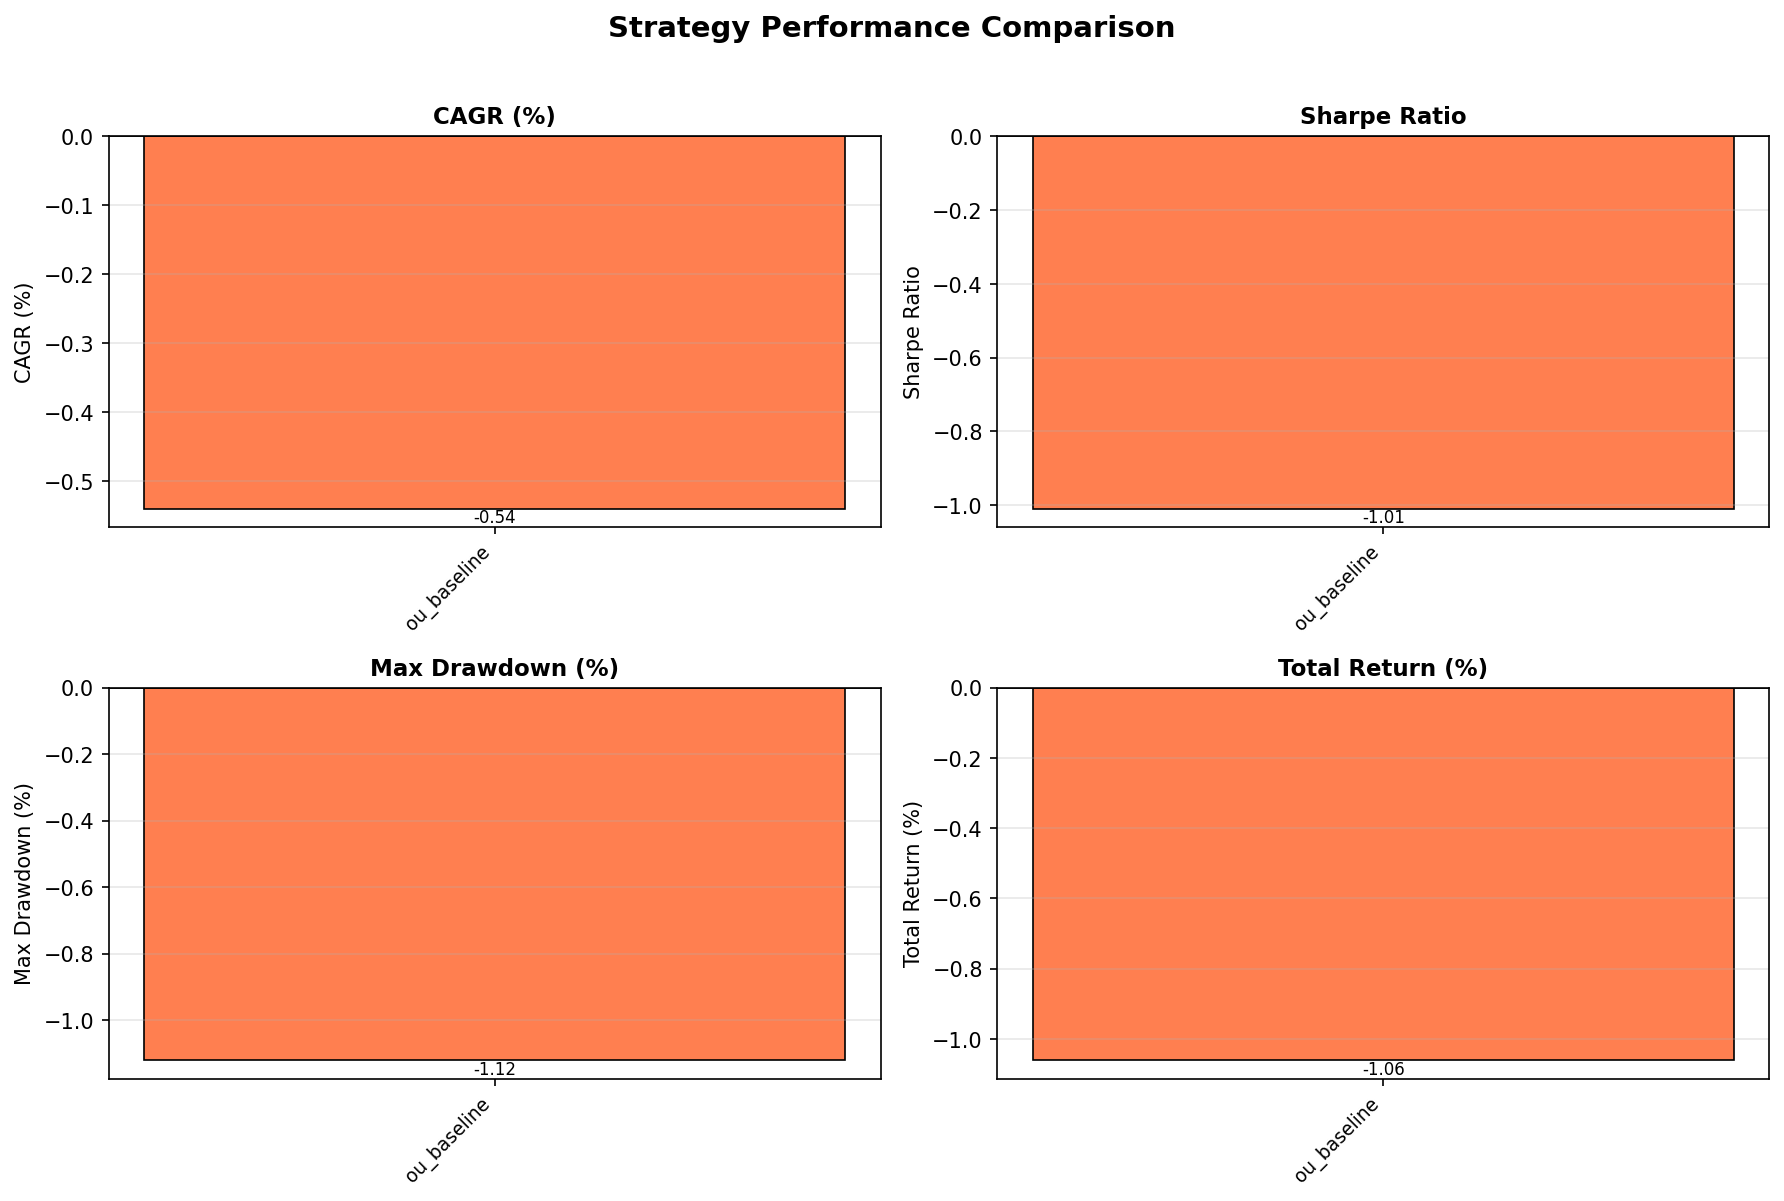
Performance Metrics
| Strategy |
CAGR |
Sharpe |
Max Drawdown |
Total Return |
| ou_baseline |
1.84 |
0.13 |
-23.77 |
5.45 |
| markov_mr |
-2.36 |
-0.15 |
-31.9 |
-6.69 |
| markov_mom |
28.62 |
1.32 |
-26.31 |
107.54 |
Visualizations
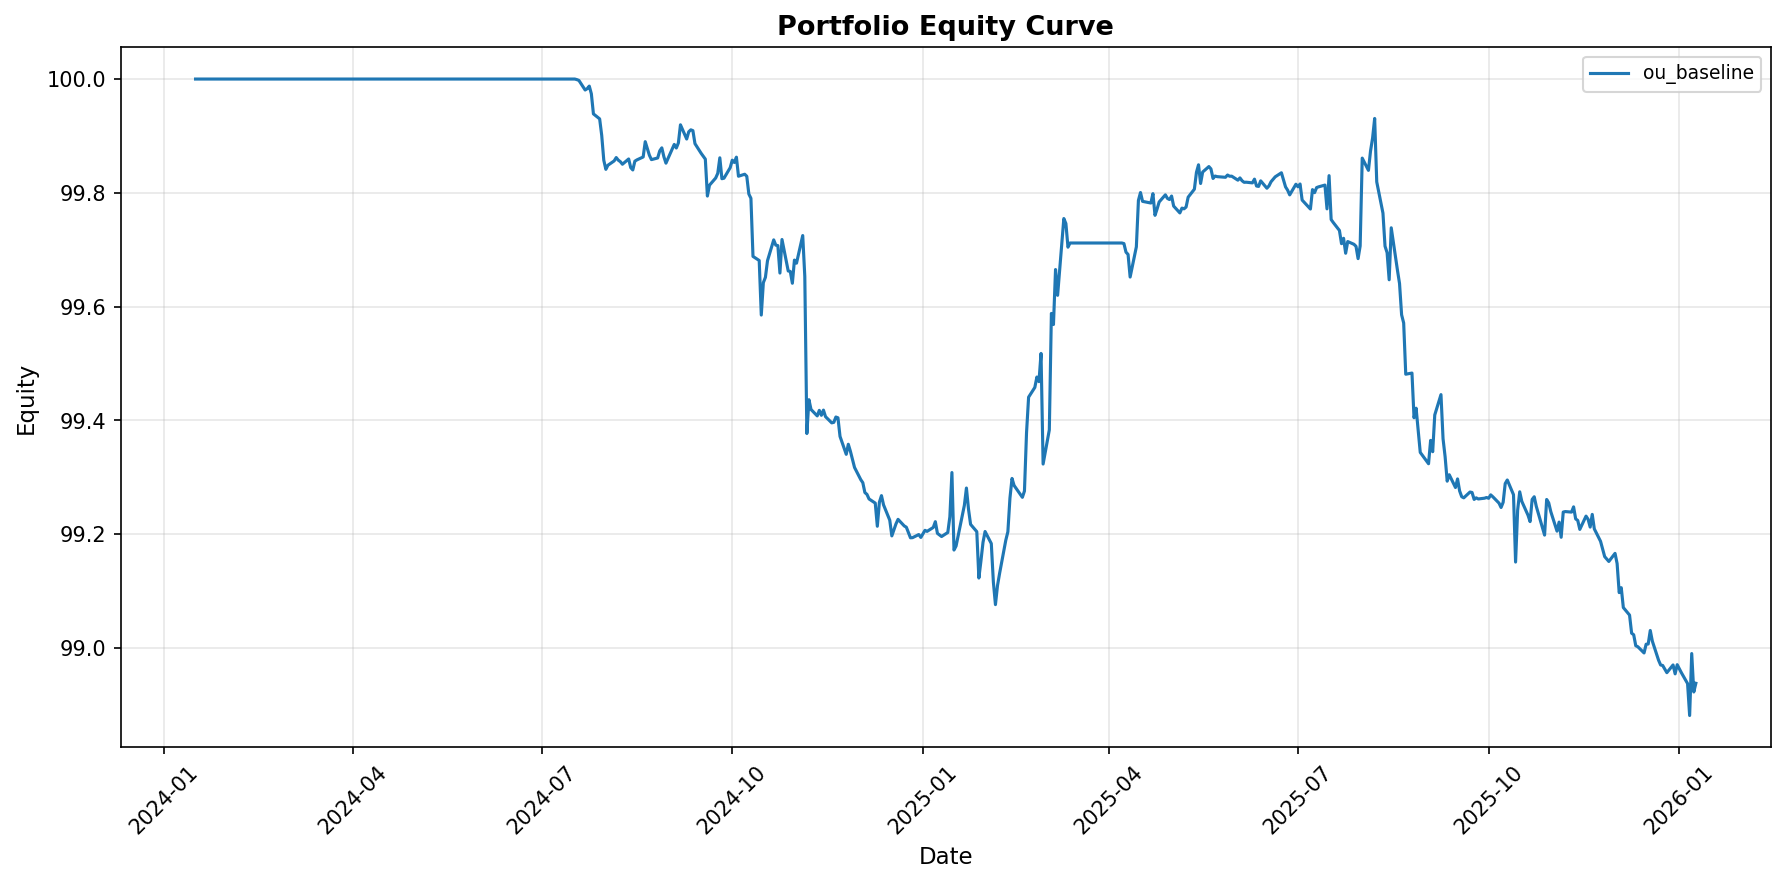
Equity Curve
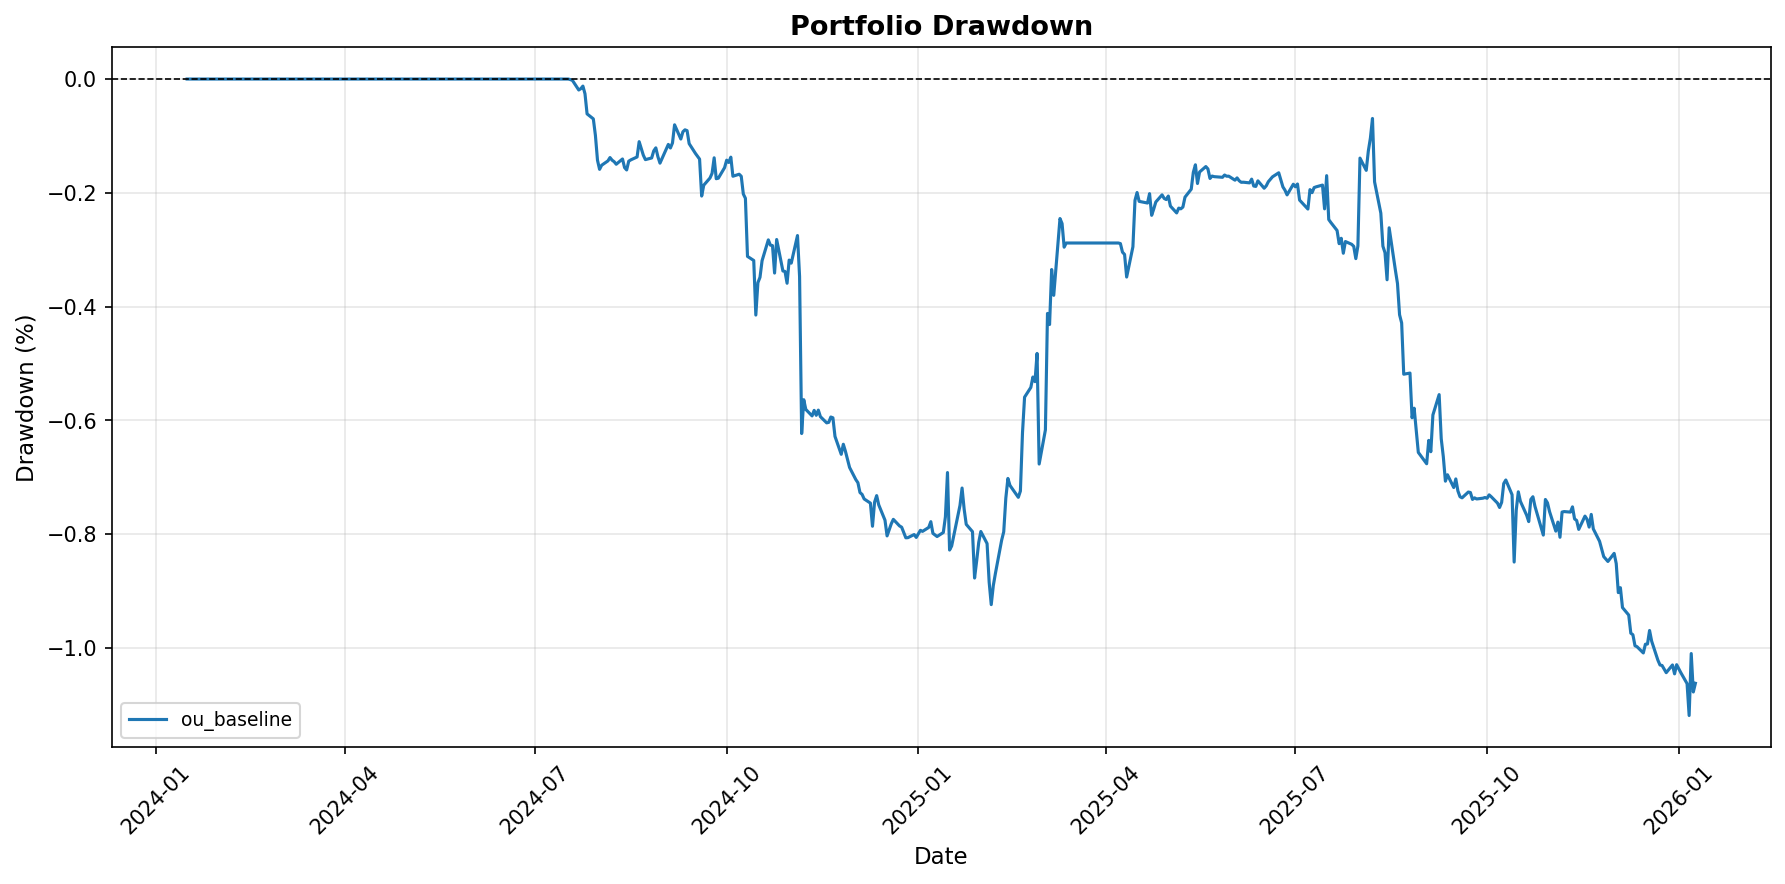
Drawdown
Strategy Comparison
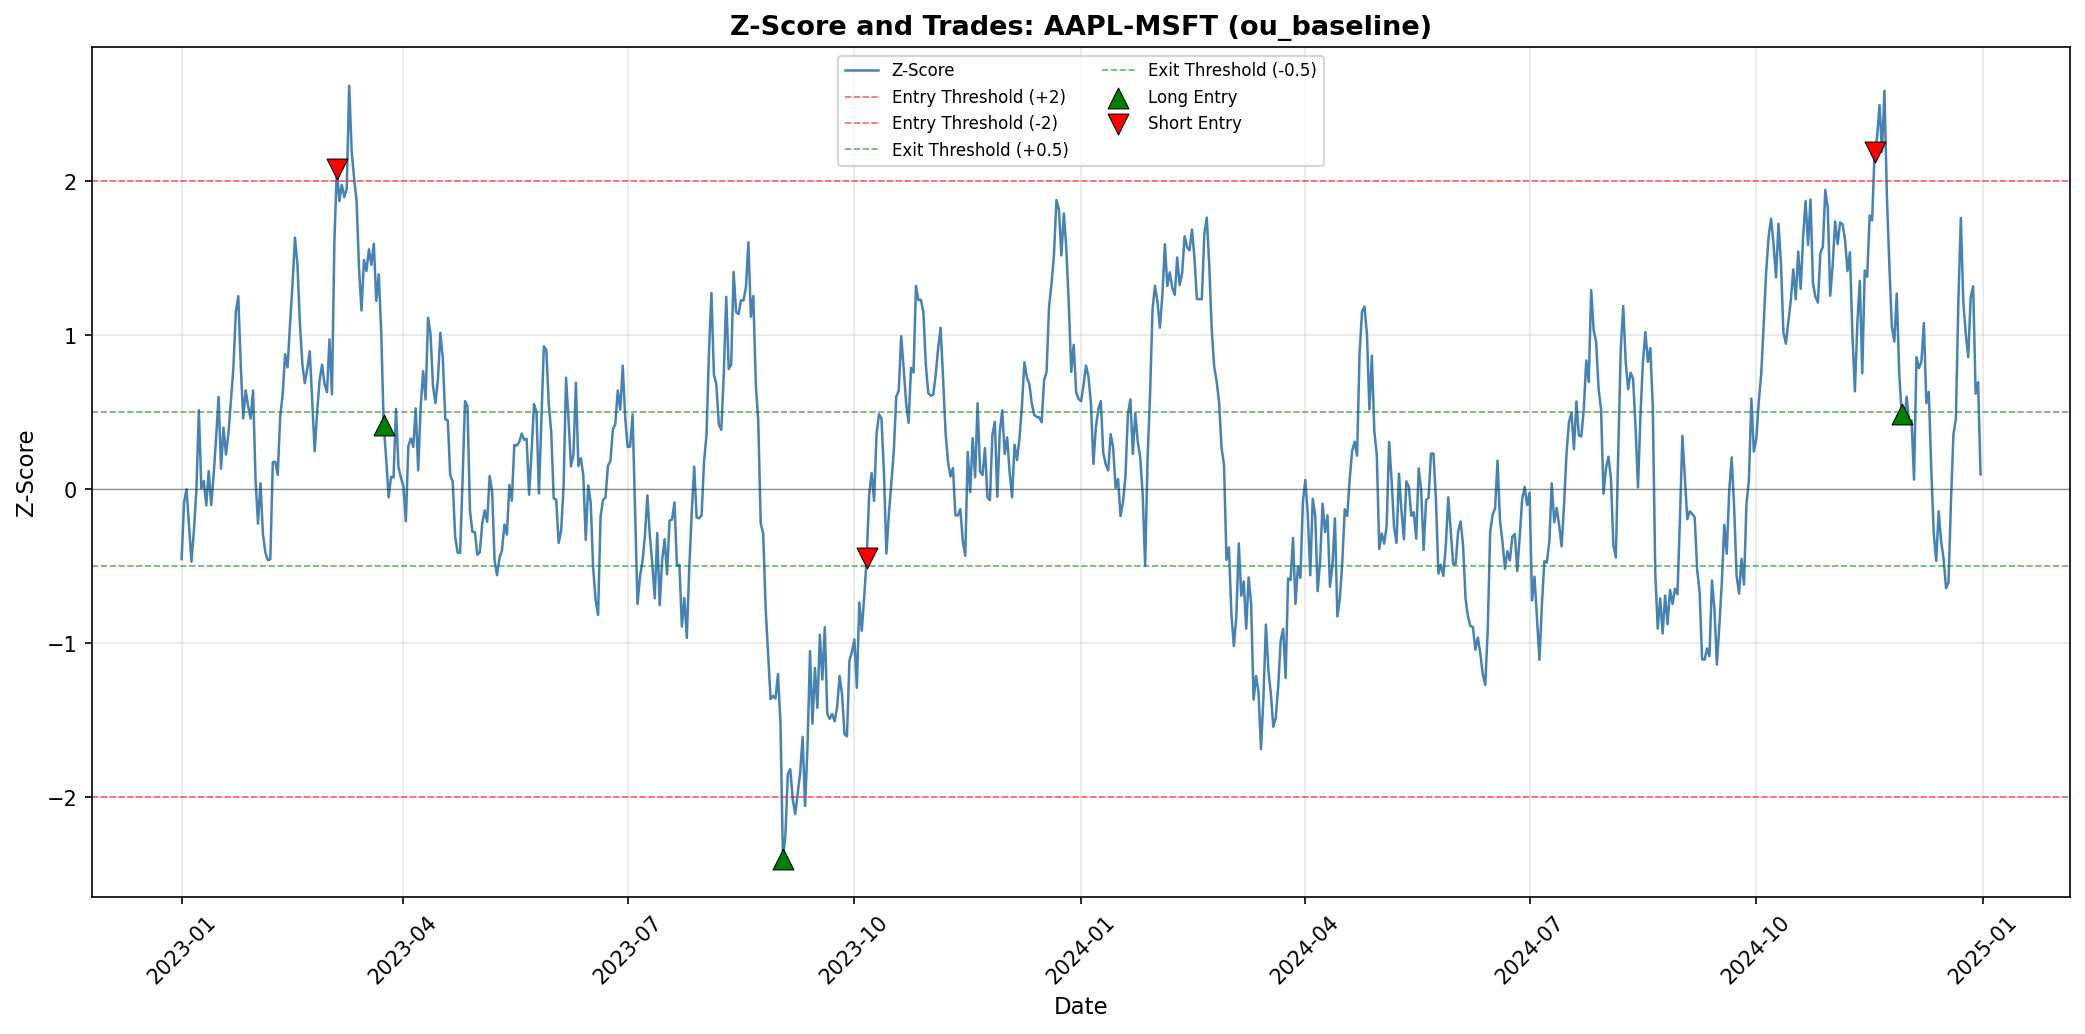
Zscore Aapl-Msft Ou Baseline
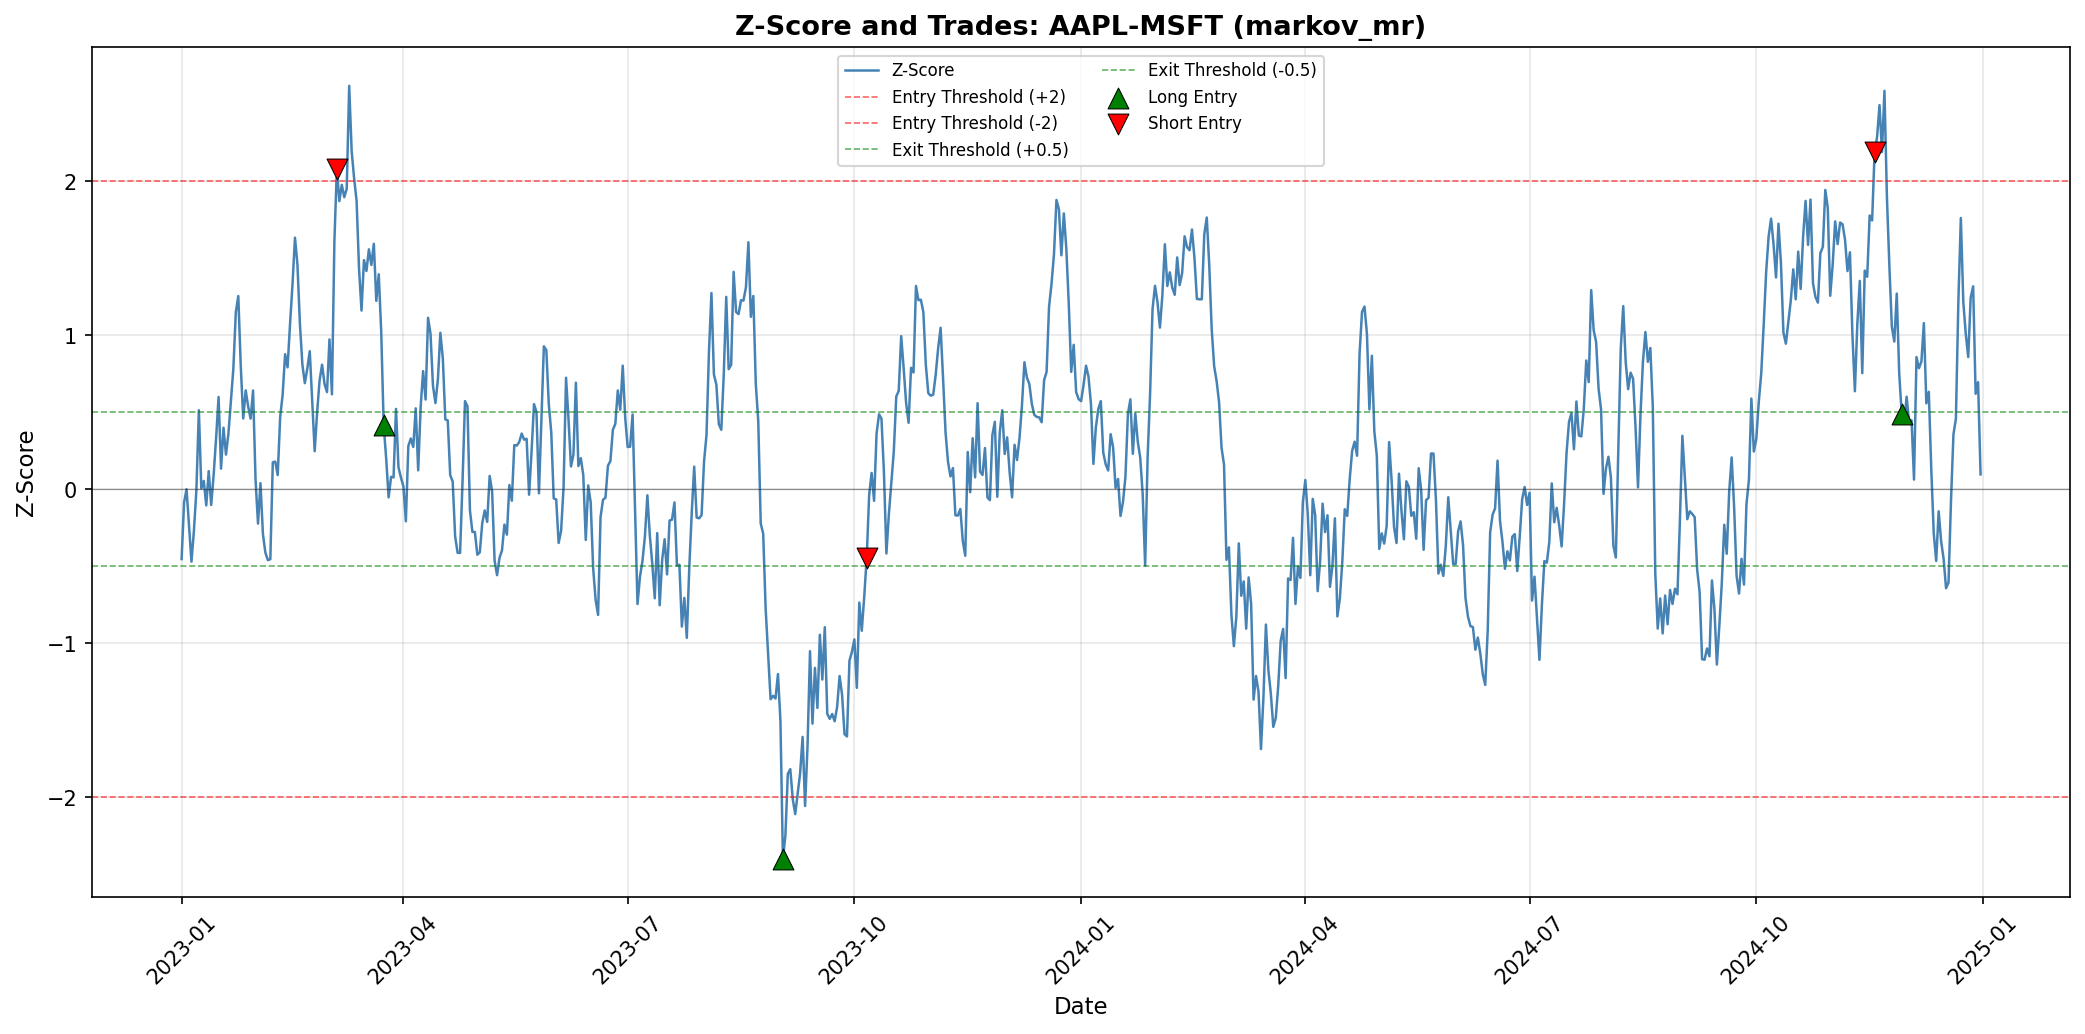
Zscore Aapl-Msft Markov Mr
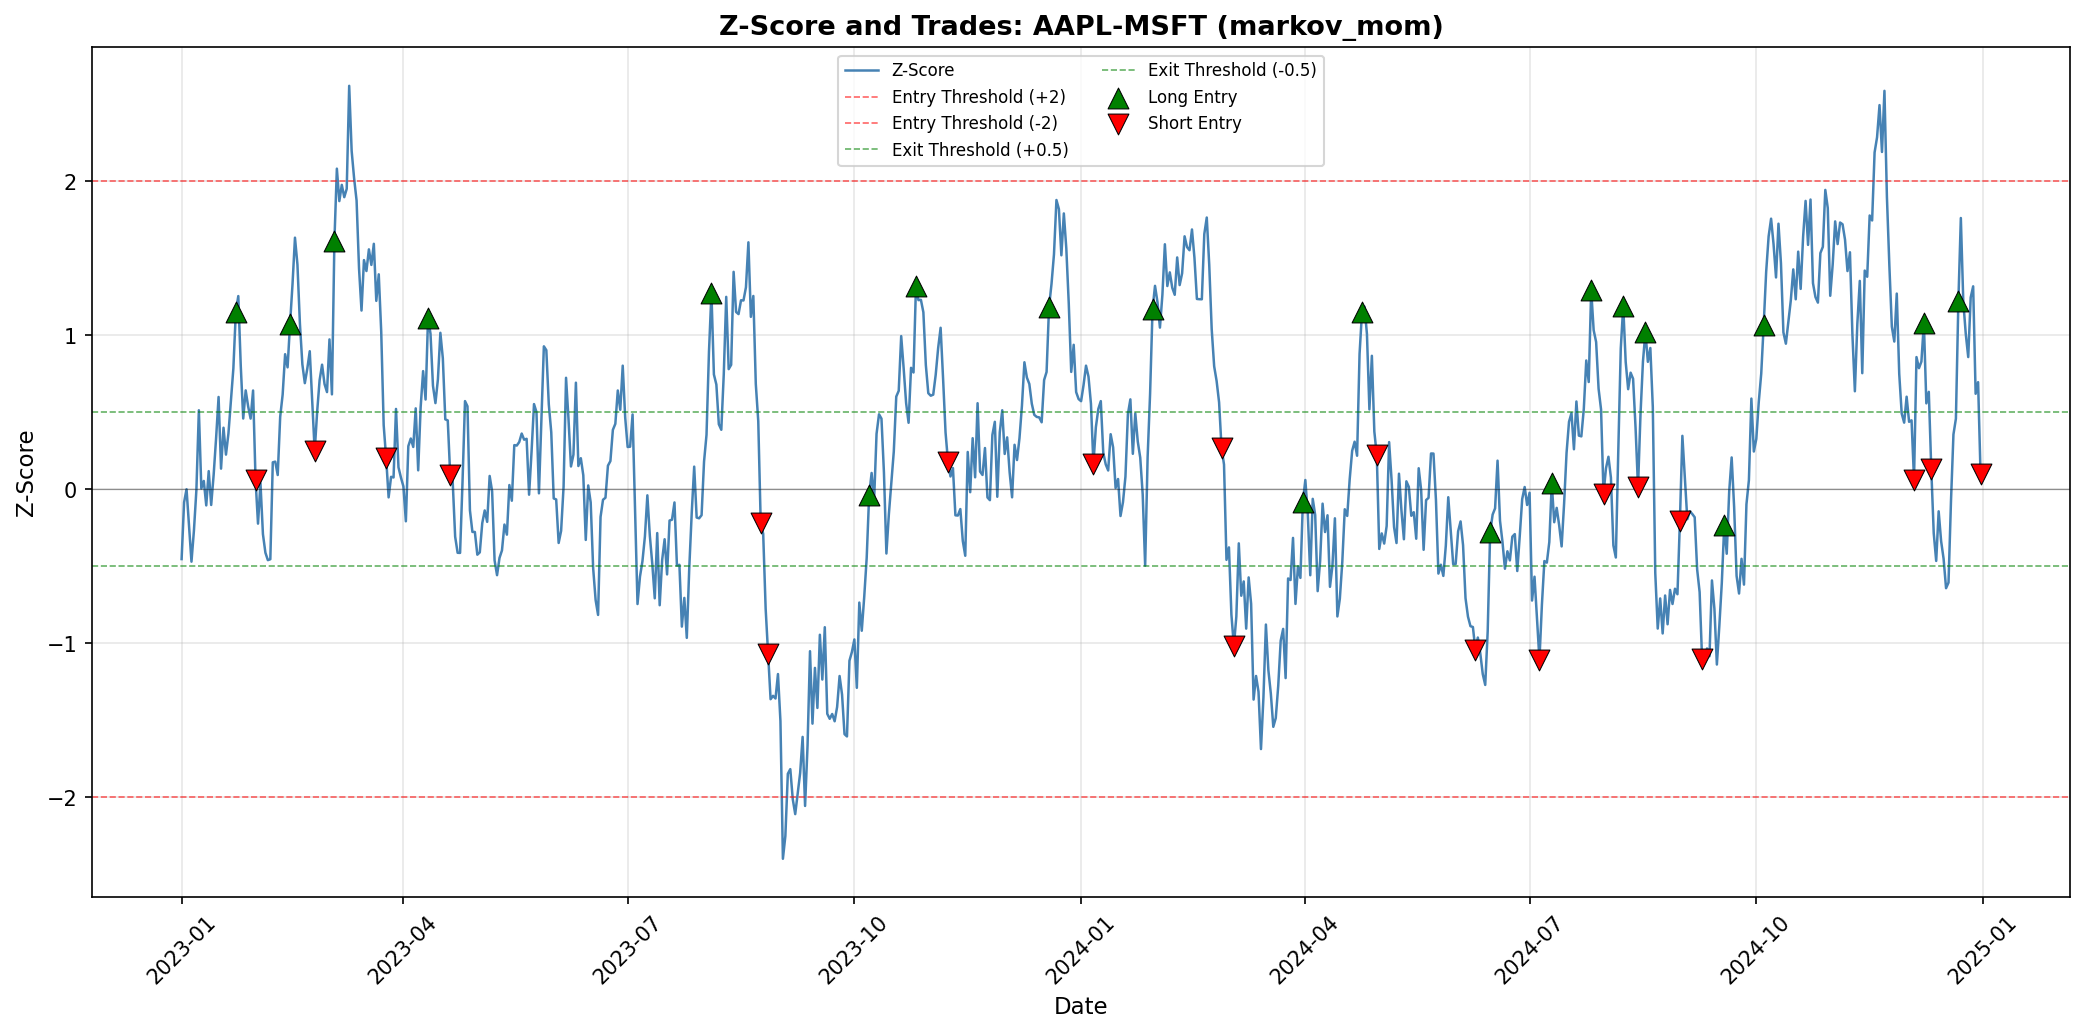
Zscore Aapl-Msft Markov Mom
Zscore Googl-Meta Ou Baseline

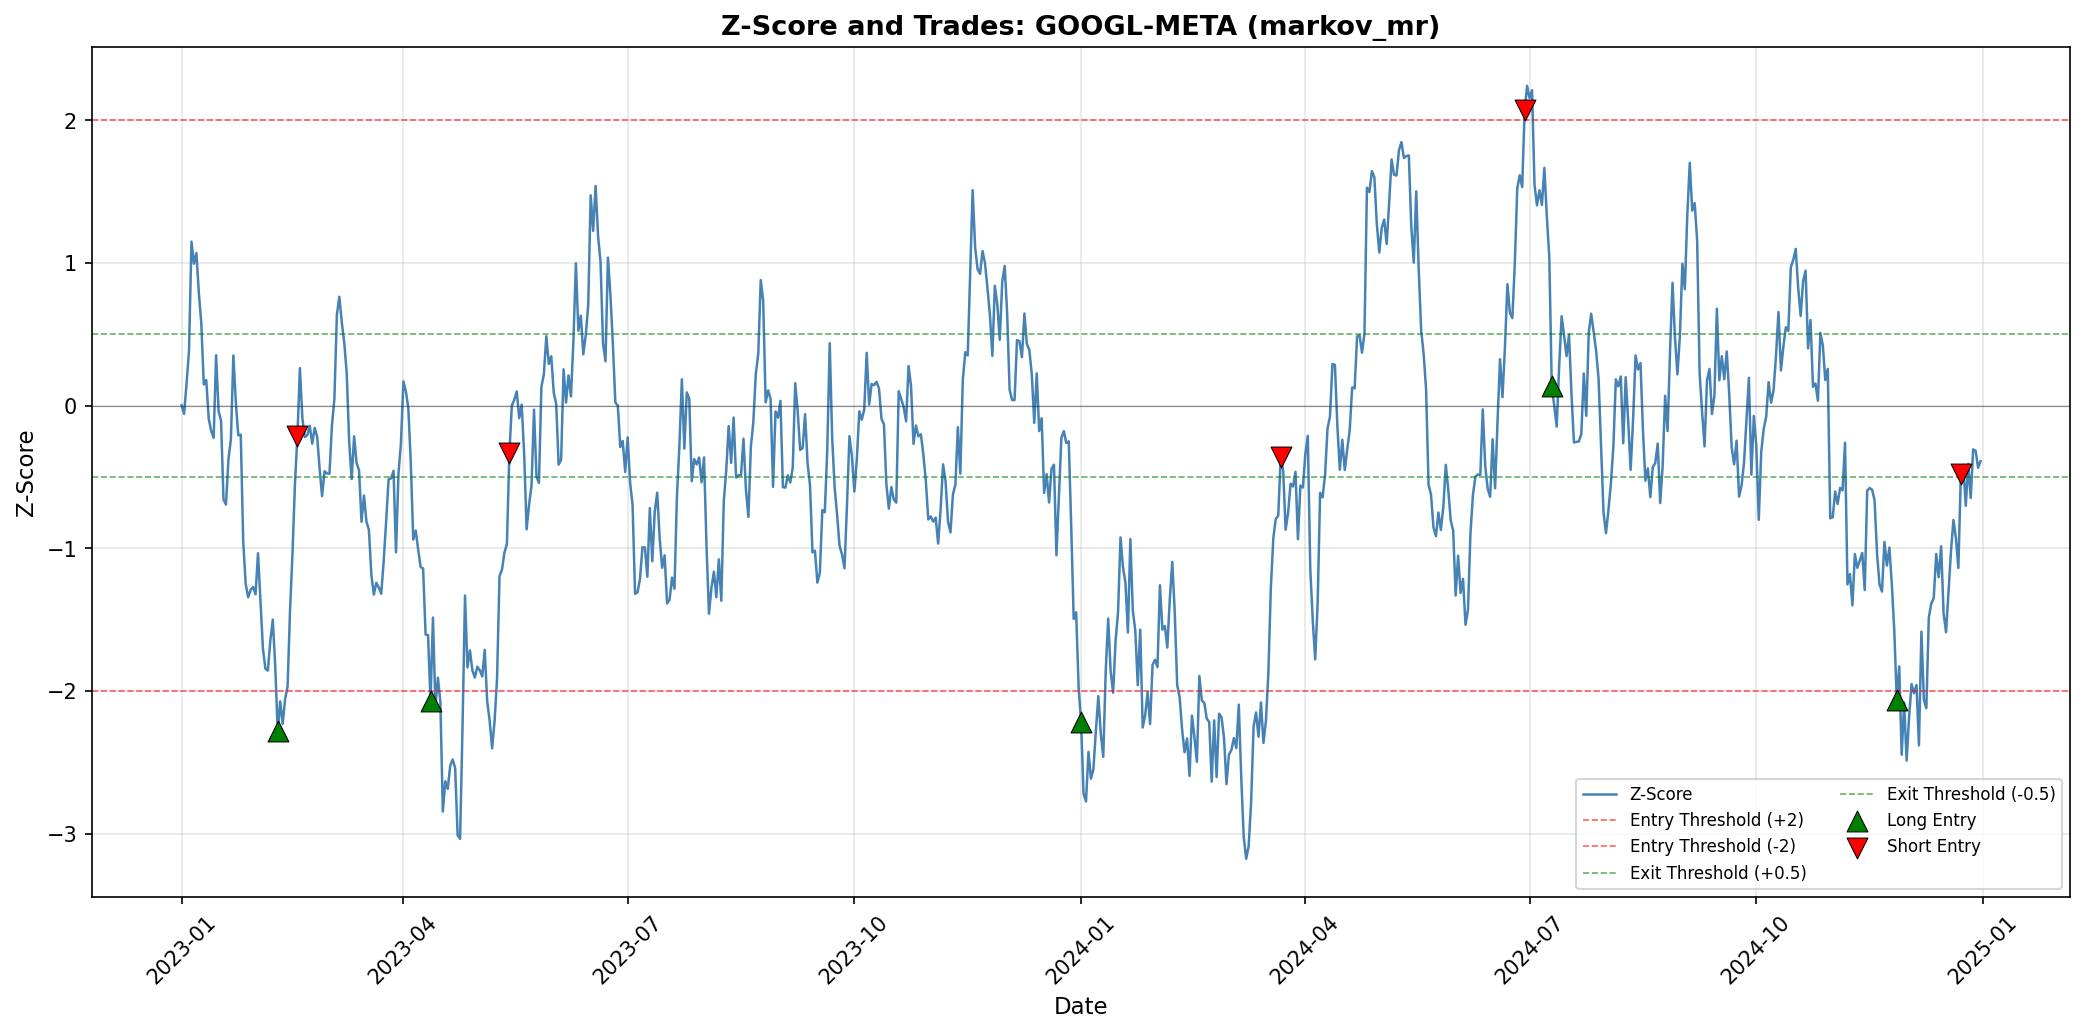
Zscore Googl-Meta Markov Mr
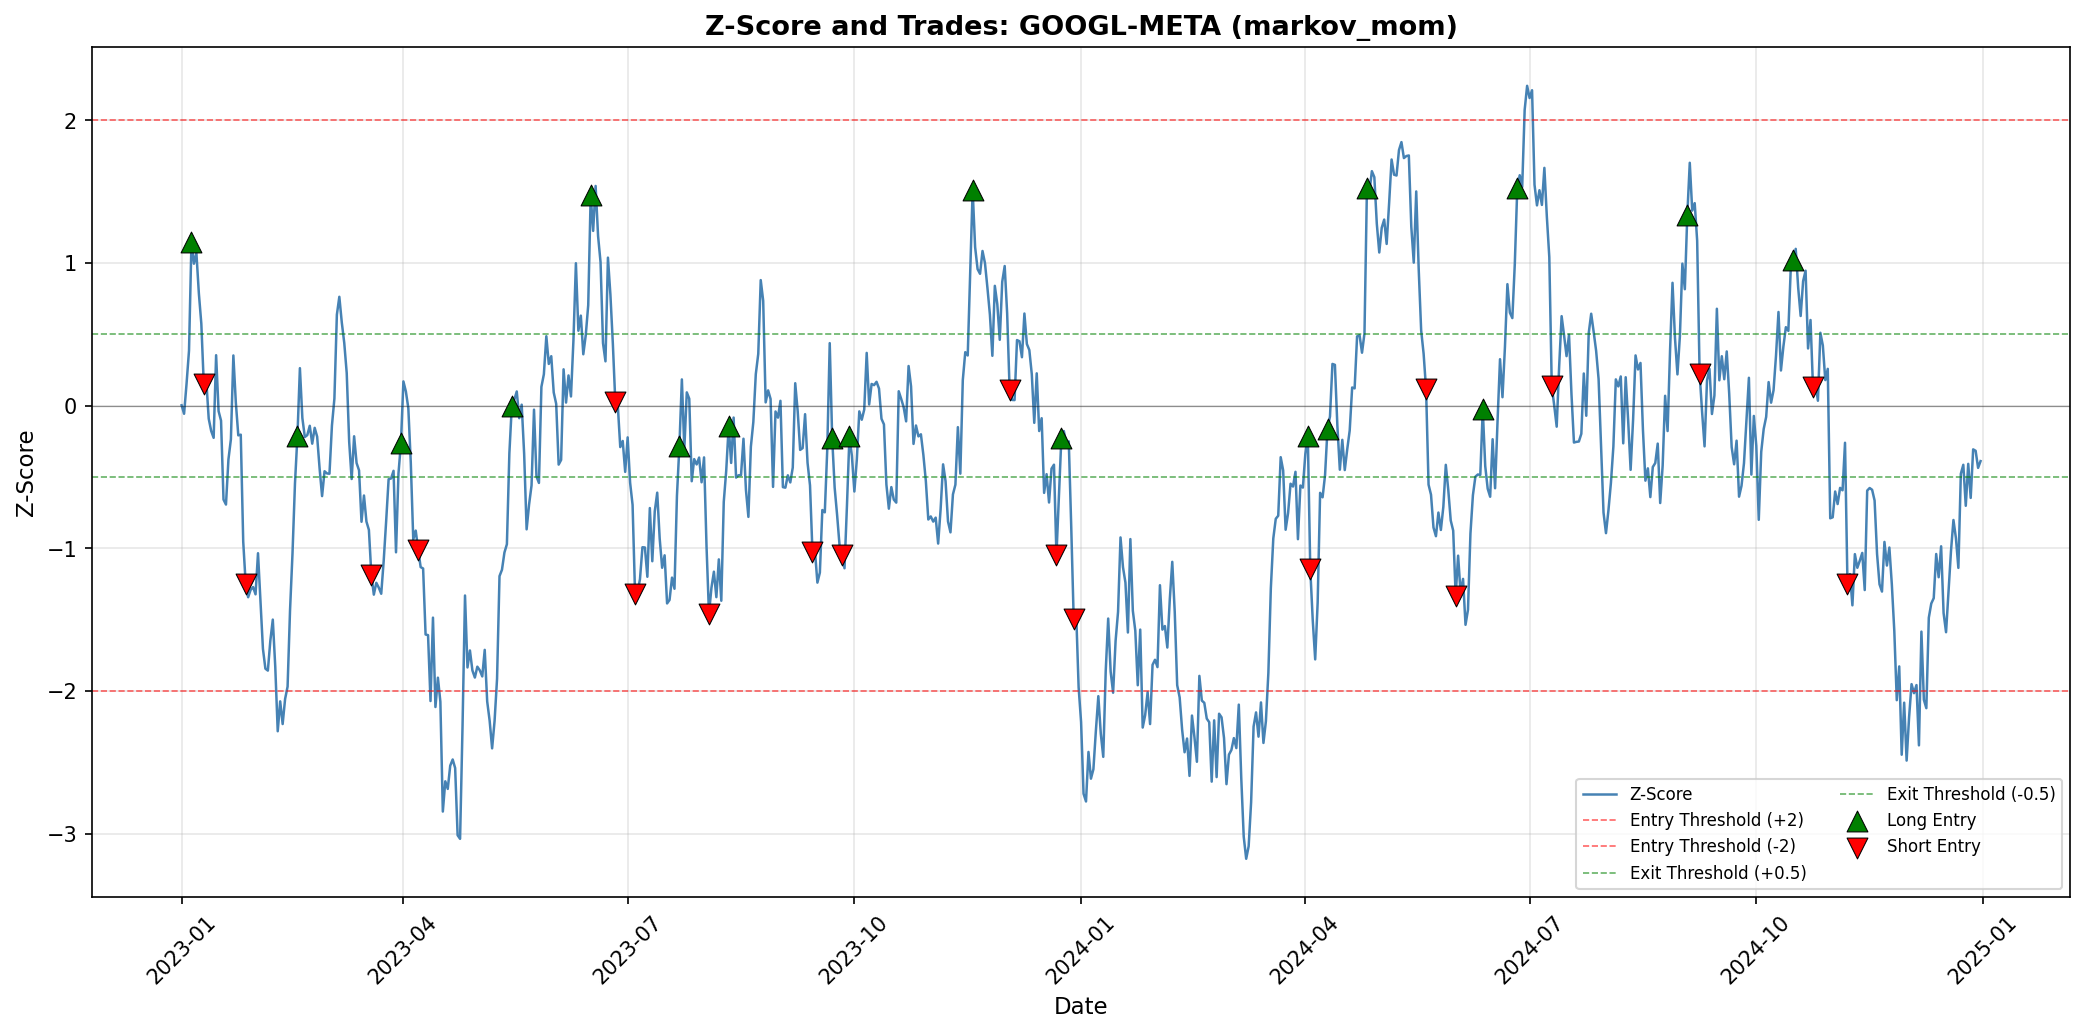
Zscore Googl-Meta Markov Mom
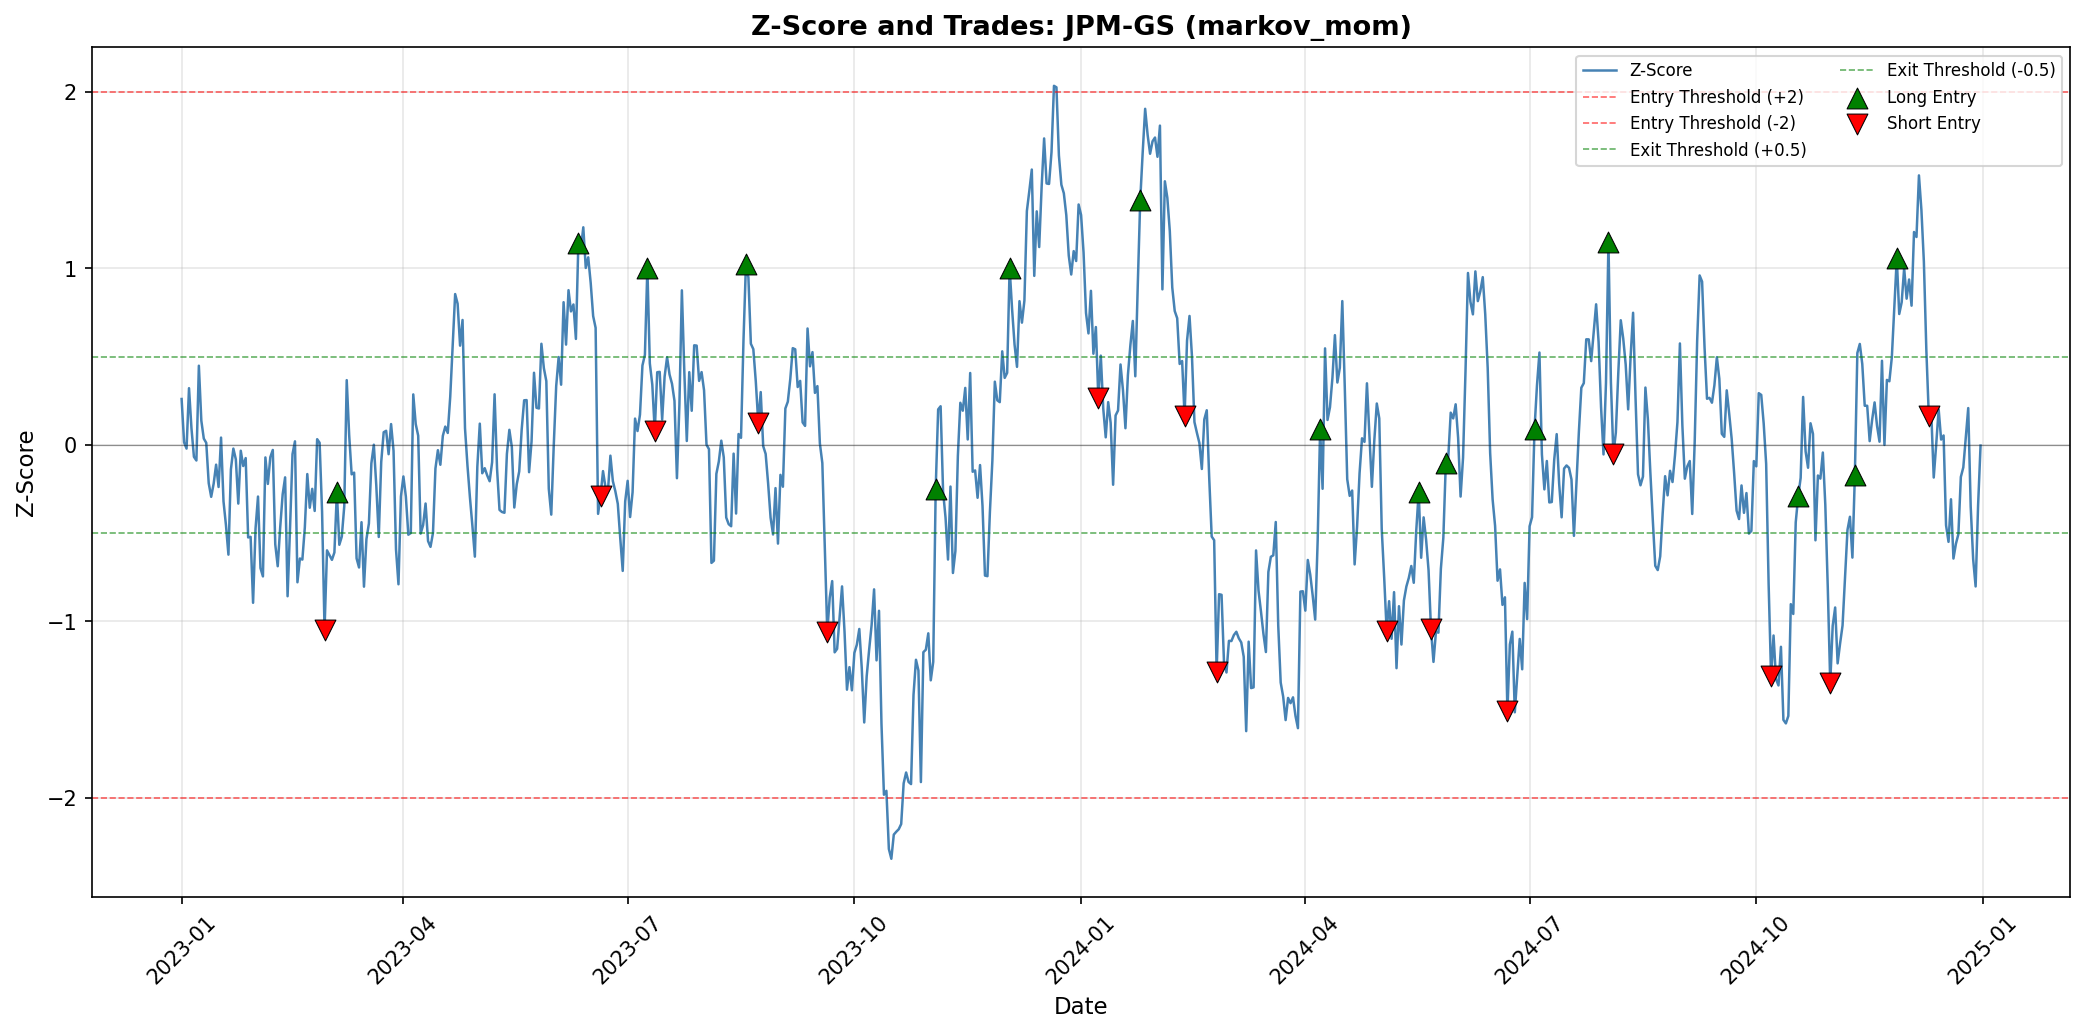
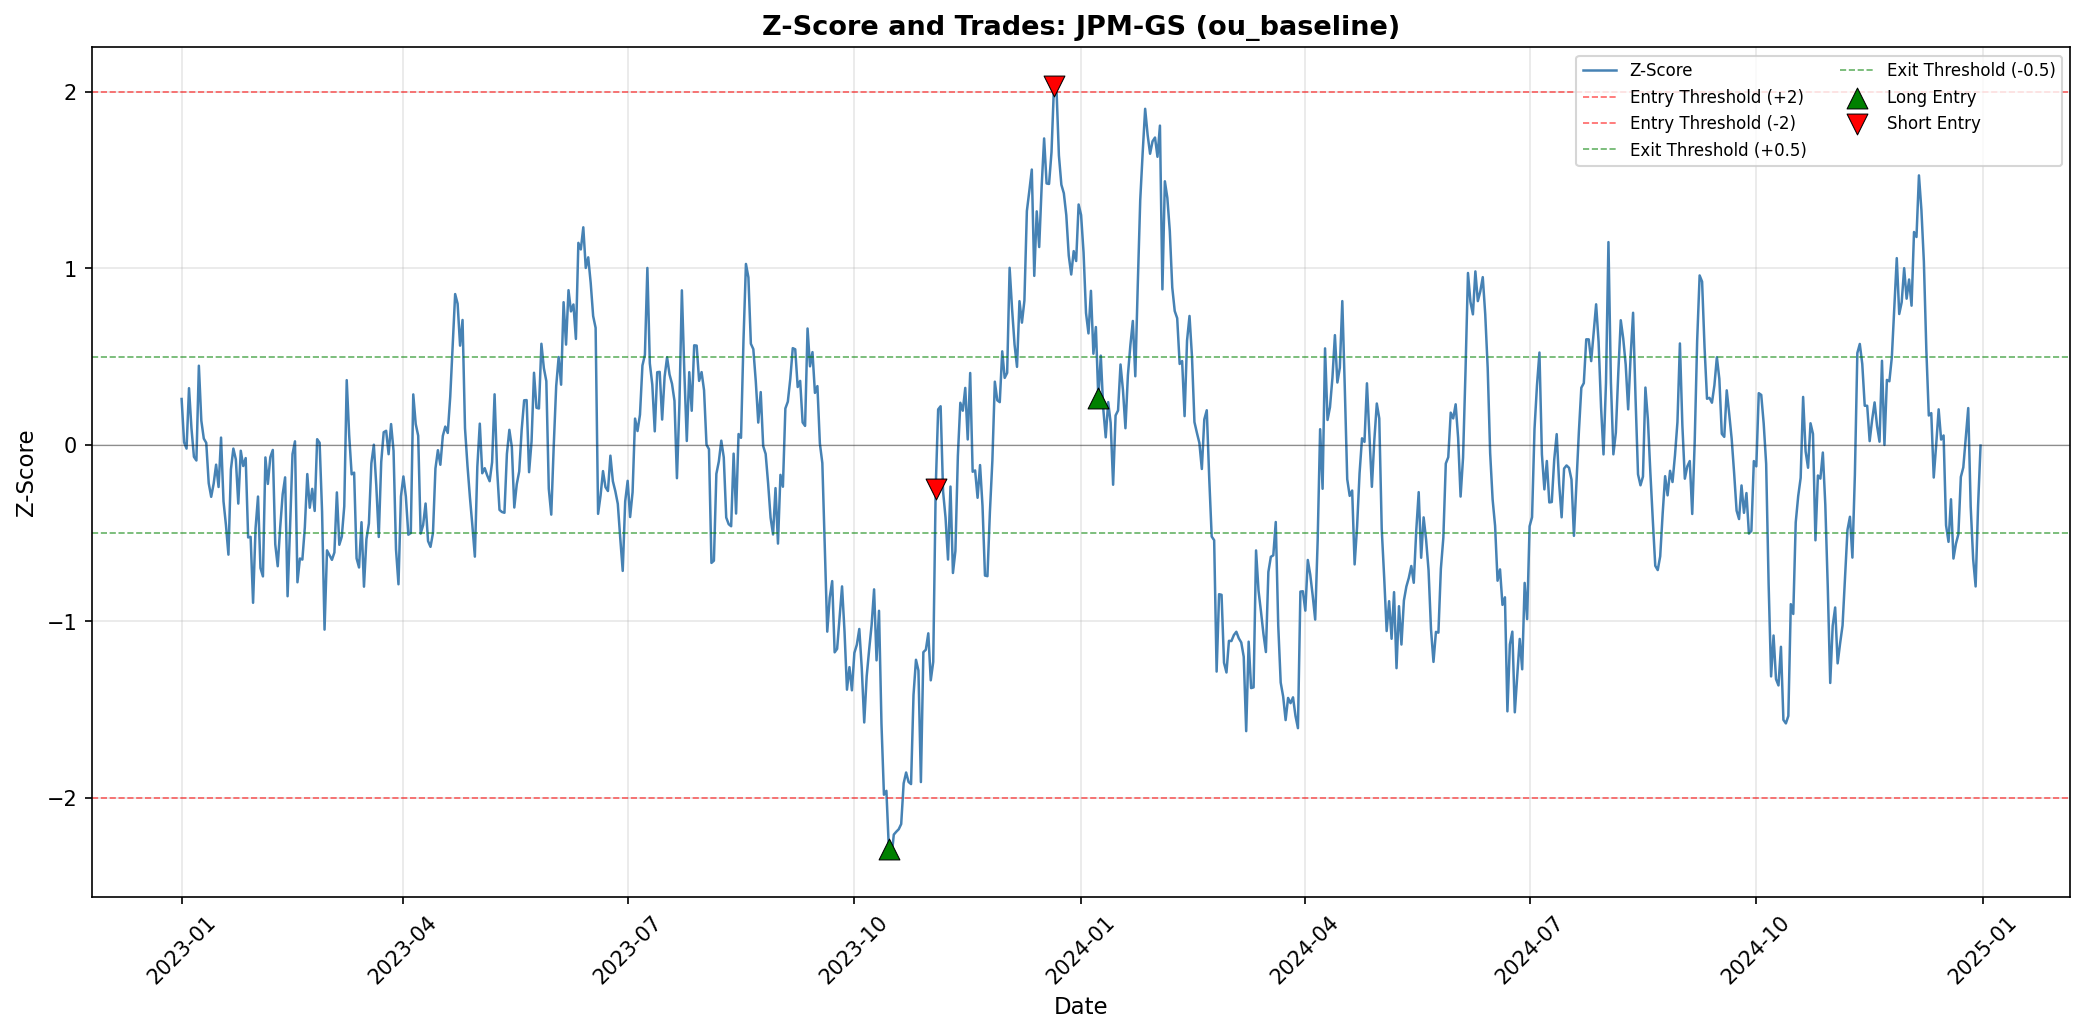
Zscore Jpm-Gs Ou Baseline
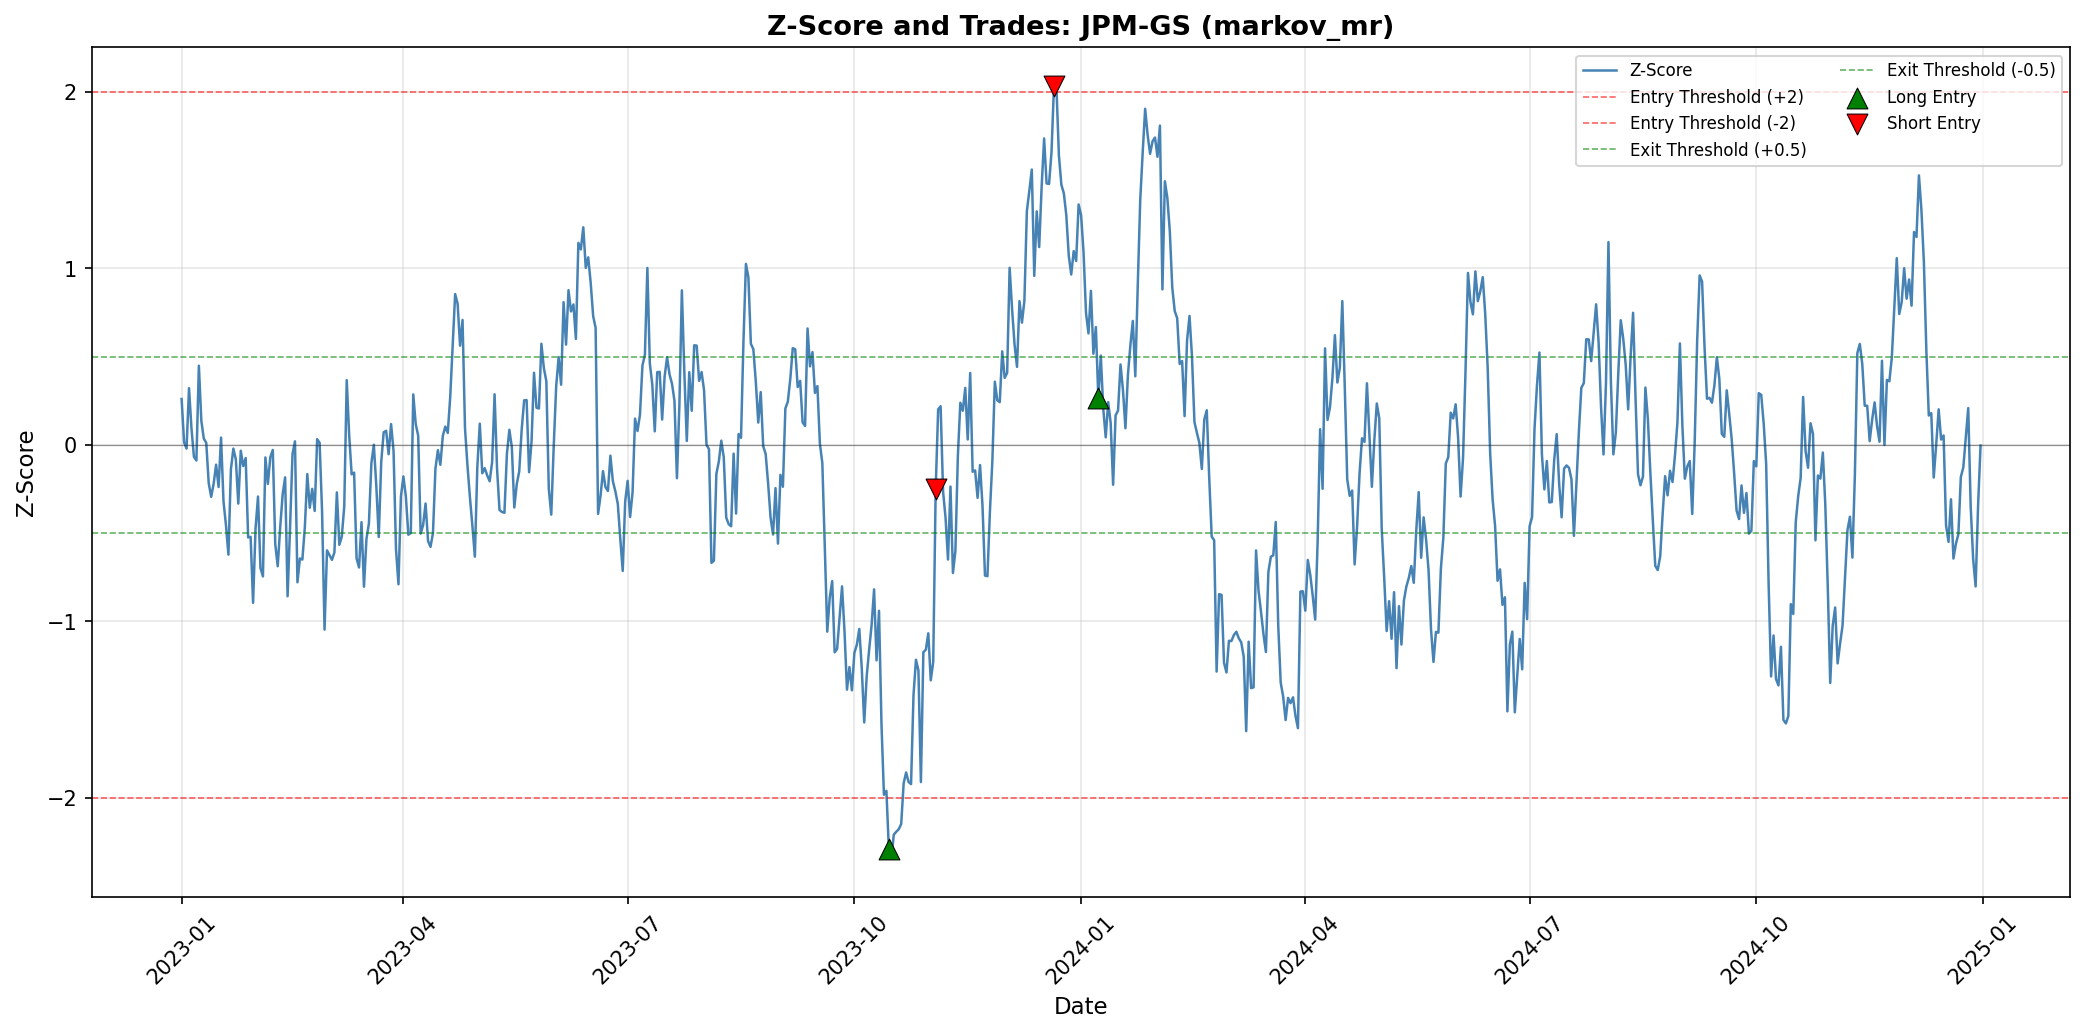
Zscore Jpm-Gs Markov Mr
Zscore Jpm-Gs Markov Mom